WhiteBIT Coin Price Analysis: WBT Above $82 Amid Quiet Trading
WBT rises 1.60% over 24 hours to $82.51 as trading volume dwindles, approaching its all-time high set last September. We review the levels and influencing factors.
· 6 min read

Bitcoin (BTC) is trading at $82,487.00 at the time of writing this analysis, with a slight increase of +0.08% over the past hour, and +0.73% over 24 hours, while recording a limited decline of -0.66% over seven days. The price moved during the day between a low of $81,155.00 and a high of $83,249.00, a trading range of approximately $2,094. Over the week, the price ranged between $80,116.63 and $83,640.13. The market capitalization of the coin is about $1,657.62 billion, with a 24-hour trading volume of $27.136 billion.
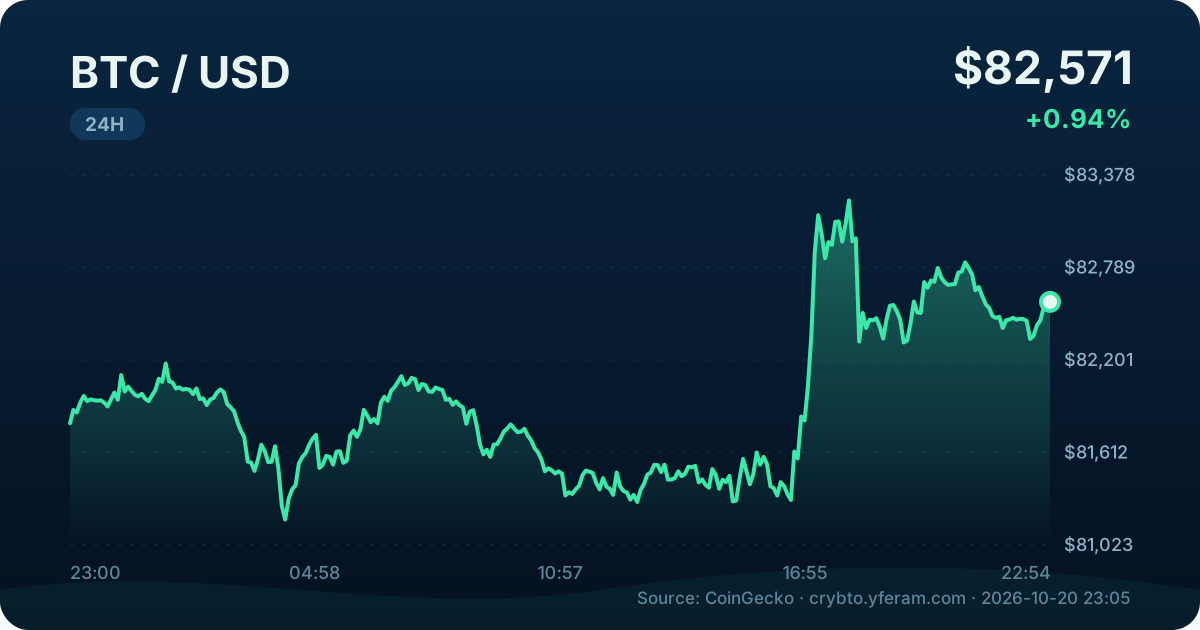
The numbers indicate that Bitcoin is going through a relatively narrow fluctuation phase. The 24-hour gain of 0.73% does not offset the weekly decline of 0.66%, meaning the price is moving within a specific range without a clear direction in the short term. The price has remained near the middle of the weekly range, i.e., in a balanced area between the weekly high and low.
This pattern of movement indicates a state of anticipation in the market. Traders are not pushing the price strongly upward, but at the same time they are not pressing it sharply downward. This is evident in the daily range, which did not exceed about 2.6% between the high and low, a range closer to calm than violent volatility.
In terms of longer-term performance, Bitcoin records a positive change of +1.69% over 30 days, while the change over a year is -25.52%. The current price remains about 34.5% below the all-time high of $126,080.00 recorded on October 6, 2025. This comparison is important because it puts the daily movement in its proper context: short-term fluctuation occurs within a fragile recovery path in the medium term, not within a strong uptrend.
The 24-hour trading volume reached $27.136 billion, a figure that reflects relatively high liquidity compared to the market capitalization of $1,657.62 billion. However, trading volume alone is not enough to judge the strength of the trend. When the price moves in a narrow range with relatively high trading volume, it may mean intensive exchange of positions between buyers and sellers without a decisive victory for either side.
From another angle, the circulating supply is 20,098,843 coins out of a maximum of 21,000,000. This means that more than 95% of the supply has already been mined, a structural feature that supports the scarcity idea on which the asset has been based since its launch in 2009. However, scarcity alone does not determine short-term price movement, as prices are affected by demand, liquidity, and market sentiment.
To understand Bitcoin's current movement, it is useful to look at the broader market context. The total market capitalization of the cryptocurrency market is about $2.78 trillion, recording a 24-hour decline of 1.65%. In contrast, Bitcoin's dominance is 59.5%. This divergence between Bitcoin's slight rise and the overall market decline means that Bitcoin is relatively outperforming the rest of the market at this moment.
This relativity appears in the performance of other major coins. Ethereum (ETH) recorded $2,434.18 with a 24-hour gain of 1.51% but a weekly decline of -2.84%. Solana (SOL) recorded $105.98 with a daily gain of 1.67% and a weekly decline of -1.59%. XRP reached $1.33 with a daily gain of 1.89% and a weekly decline of -3.14%. It is noticeable that most of these coins recorded daily gains but ended the week lower, the same pattern seen with Bitcoin.
The impact of traditional markets cannot be ignored. The S&P 500 closed at 7,712.57, up 0.28%, while the Nasdaq declined by 0.02% to 26,424.82. In metals markets, gold recorded $4,140.10 per ounce, down -0.48%, while silver rose to $57.92 per ounce by 1.12%. These divergent movements reflect an investment environment with no unified direction, which usually reflects on high-risk assets such as cryptocurrencies.
The Fear and Greed Index also indicates a reading of 55, i.e., in the greed zone. This reading means that sentiment tends toward optimism, but it is not at levels of extreme greed. Typically, this zone corresponds to markets moving upward cautiously or fluctuating without momentum.
A balanced reading of the data indicates a market awaiting a clear catalyst, not a market in a decisive upward or downward trend.

Based on the available figures, some areas that may be of psychological and technical importance to traders can be identified:
It is important to treat these levels as monitoring zones, not predictions. The price may break through or below them without warning, especially in a market that operates 24 hours and is affected by news and global liquidity.
The stability of Bitcoin's dominance at 59.5% with the decline in total market capitalization shows that capital is not necessarily exiting Bitcoin; rather, part of the selling pressure is concentrated in smaller assets. This does not mean Bitcoin is immune, but it means its relative performance is better than the market average.
The difference between the positive monthly change (+1.69%) and the negative annual change (-25.52%) also reflects a gradual recovery phase from a major correction. The market has not yet regained its previous levels, but it has also not returned to its lowest levels. This middle zone is usually accompanied by investor caution and trader anticipation.
Bitcoin is currently trading at $82,487.00 within a narrow range, with a slight daily gain and a limited weekly decline. Trading volume is relatively high, but it has not produced a clear direction. The coin's dominance over the market exceeds 59%, reflecting its relatively strong position despite the overall market decline. The Fear and Greed Index at 55 indicates cautiously positive sentiment.
In this type of market, risk management becomes more important than trying to predict direction. The oscillator may move in either direction when a new catalyst appears. The current price remains 34.5% below the all-time high, which is a reminder that digital assets are highly volatile and that past performance does not guarantee future performance.
This analysis is descriptive based on available data and is not an investment recommendation. Investors should realize that cryptocurrency volatility can be sharp, and the potential loss size requires a personal assessment of risk tolerance.
Information shown is for tracking only and is not investment advice.

WBT rises 1.60% over 24 hours to $82.51 as trading volume dwindles, approaching its all-time high set last September. We review the levels and influencing factors.

Dogecoin trades near $0.0822 with a slight gain over 24 hours and a limited weekly decline, amid moderate liquidity and a broader market leaning toward calm.

Tron is trading at $0.3314 with a slight rise over 24 hours, but is down 0.55% over the week. We review the price action, trading volume, influencing factors and levels to watch.