Daily Crypto Analysis: Mixed Performance Amid High Bitcoin Dominance
Crypto market declines on the week despite a limited rebound over 24 hours, with Bitcoin dominance at 59.5% and the Fear and Greed Index in greed territory.
· 5 min read
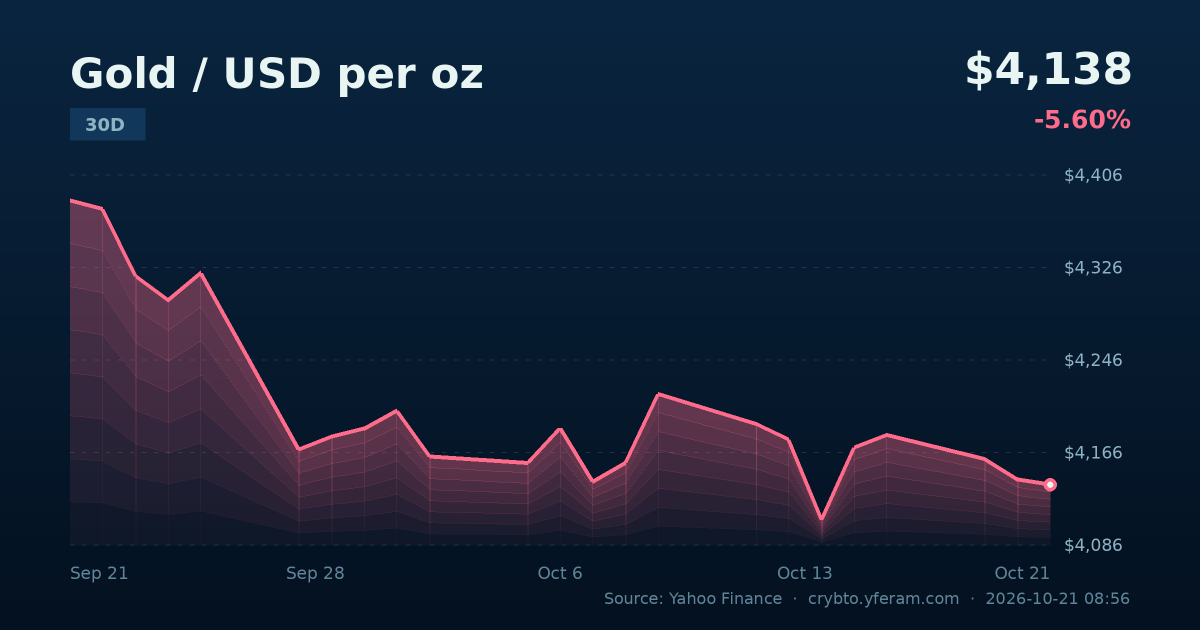
Gold is trading in the current session at $4,138.30 per ounce, with a slight daily decline of -0.10%. The intraday high reached $4,146.30, while the low was recorded at $4,132.40.
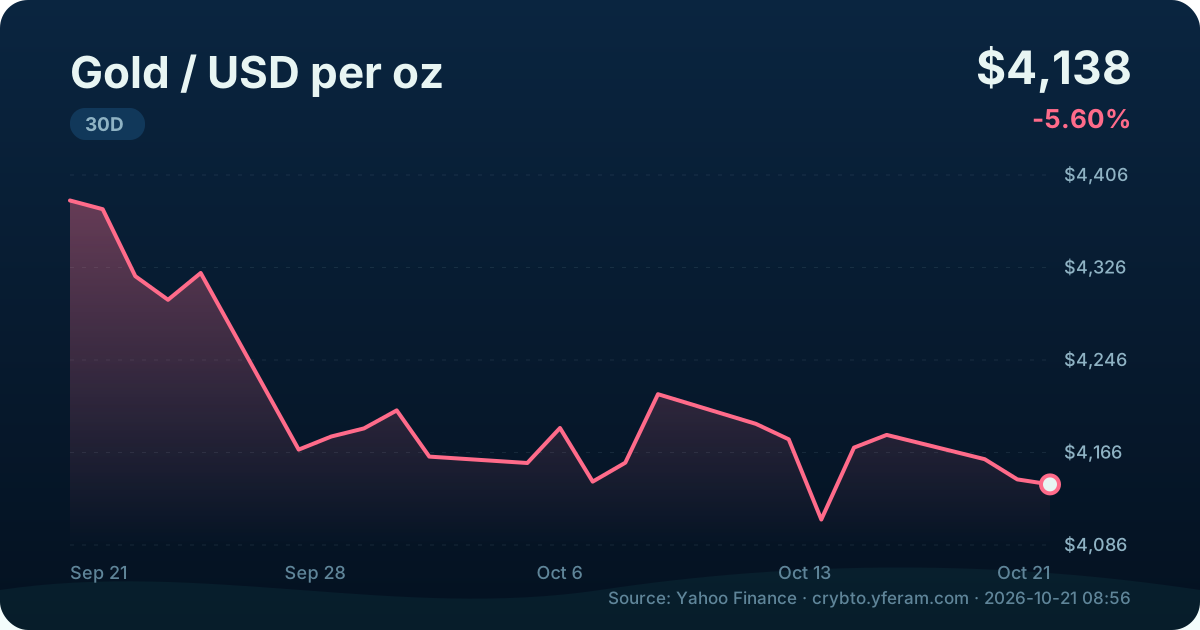
This narrow range reflects a relatively quiet session, with no sharp catalysts pushing the price in one direction. But the picture changes when looking at the longer term.
The price per gram is equivalent to $133.05, or approximately €118.51. Gram prices by karat are distributed as follows:
| Karat | Price in euros per gram |
|---|---|
| 24 karat | 118.51 |
| 22 karat | 108.64 |
| 21 karat | 103.70 |
| 18 karat | 88.89 |
These figures matter more to consumers than to institutional investors, but they provide a tangible picture of the current pricing level in local markets.
More important than today's move is the change over the month, which reached -5.60%. This is not a collapse, but it is a clear correction after a strong rally that took the metal to record levels.
A decline of this size in a relatively low-volatility asset means the market is reassessing some assumptions. There are several possible explanations, and none can be confirmed without additional flow data.
These factors are not mutually exclusive and may intersect in a single explanation. What matters is noting that the decline is happening quietly, not in a wave of panicked selling.
The gold-to-silver ratio currently stands at 71.9. Silver is trading at $57.53 per ounce, with a daily decline of -0.82%.
This ratio is a common analytical tool. When it rises, it means gold is outperforming silver. This usually points to a climate of caution, where investors prefer the more stable asset over the industrial metal that is more sensitive to the economic cycle.
A rising gold-to-silver ratio is not a buy or sell signal, but an indicator of the market's mood toward risk.
This ratio does not move in isolation from the rest of the markets. It also reflects the state of industrial demand for silver, which is tied to manufacturing, electronics, and solar energy.
Gold cannot be read today in isolation from other assets. The cryptocurrency market shows a clear divergence:
The total market capitalization of digital assets stands at $2.78 trillion, down -1.87% on the day, with Bitcoin dominance at 59.5%. The Fear and Greed Index stands at 63, meaning in the greed zone.
This mix is interesting. Digital markets are rising daily but falling weekly, and gold is declining quietly on a monthly basis. The market does not look scared, but it also does not look uniformly enthusiastic.
The S&P 500 is at 7,712.57, up slightly 0.28%, and the Nasdaq is at 26,424.82, down marginally -0.02%. These figures point to a quiet equities session that is not pulling gold strongly in either direction.
Usually, when stocks rise strongly, gold tends to decline. When they fall, it tends to rise. But the relationship is not mechanical, and today stocks are not providing a clear catalyst.
Gold is not an ordinary asset. It does not yield a return, does not distribute profits, and is not issued by a central authority. Its value comes from an old collective agreement that it is a store of value. This makes it more sensitive to confidence than anything else.
When we talk about gold at $4,138, we are talking about a market that reflects inflation expectations, interest rates, and geopolitical risks all at once. The monthly decline of 5.60% does not negate the broader uptrend, but it calls for monitoring.
The current picture is not one of crisis. Gold is declining quietly, digital markets are moving within narrow ranges, and stocks are calm. But this calm itself may be a prelude to a larger move.
The investor who views gold as a long-term hedge will not be shaken by a monthly move of 5.60%. As for those who treat it as a short-term speculation, they must realize that volatility is part of the game.
Disclaimer: This report is analytical and does not constitute investment advice. Metal and digital asset prices are volatile and may change quickly. Any investment decision should be based on personal research and risk tolerance.
Information shown is for tracking only and is not investment advice.
Crypto market declines on the week despite a limited rebound over 24 hours, with Bitcoin dominance at 59.5% and the Fear and Greed Index in greed territory.

The price of Binance Coin (BNB) today is $739.29, with a positive change over 24 hours, while experiencing a slight decline over the week. What do these movements indicate?

Bitcoin trades at $82,487 with a slight daily gain and limited weekly decline, amid over 59% dominance in a retreating overall market. Analysis of levels and influencing factors.