
Bitcoin Above $82K: Price Analysis Amid 59.5% Dominance
Bitcoin trades at $82,487 with a slight daily gain and limited weekly decline, amid over 59% dominance in a retreating overall market. Analysis of levels and influencing factors.
· 5 min read
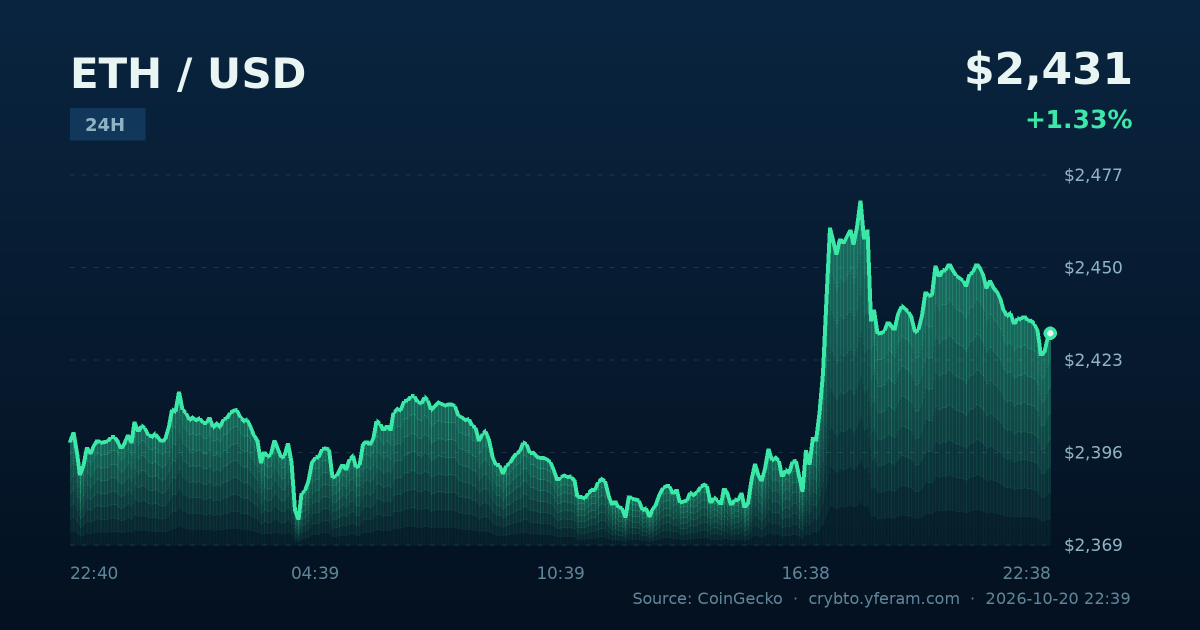
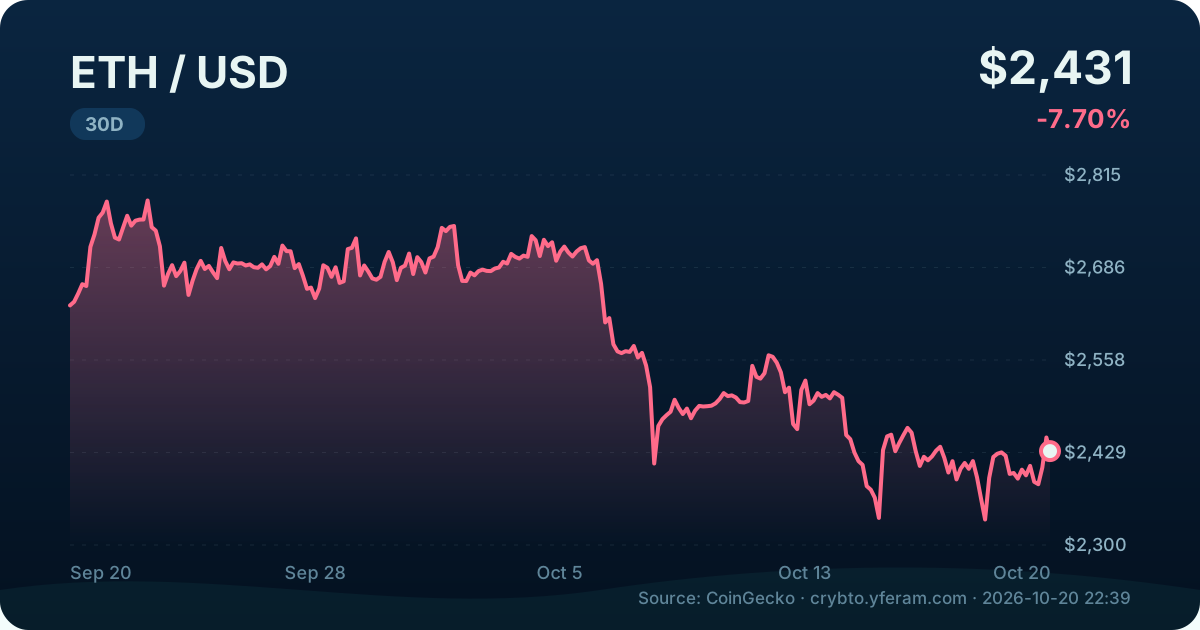
Ethereum (ETH) is trading at $2,430.85 at the time of preparing this analysis, up 1.36% over 24 hours, but still down 2.51% over the week. The price ranged during the day between a low of $2,374.52 and a high of $2,471.63, while market capitalization reached $296.83 billion and 24-hour trading volume was $10.842 billion. Over the longer term, the price remains 50.9% below its all-time high of $4,946.05 recorded on August 24, 2025, with a decline of 7.44% over 30 days and 38.83% over one year.

The daily move is positive but limited. Ethereum rose from a low near $2,374 to the $2,471 area before giving back part of its gains to settle near $2,430. This pattern points to a recovery attempt within a narrow trading range, not a clear breakout.
The price recorded a slight decline of 0.47% over the last hour, reflecting the absence of strong buying momentum at higher levels. On the other hand, trading volume remained relatively high at $10.842 billion, suggesting notable trading activity without translating into a decisive uptrend.
The broader market context explains part of this picture. Bitcoin rose 0.60% over 24 hours to $82,419, while Solana recorded 1.54%, BNB 1.41% and XRP 1.62%. That is, most major coins moved in the same direction, but with modest gains. At the same time, total cryptocurrency market capitalization fell 1.92% to $2.78 trillion, with Bitcoin dominance at 59.5%.
The weekly picture is less positive. Ethereum fell 2.51% over seven days, after moving between a low of $2,348.00 and a high of $2,512.84. This range is equivalent to roughly $165 between the bottom and the top, a relatively wide range compared with a single day's move.
Comparing daily and weekly performance reveals that the price recovered part of its losses in the last session, but failed to erase the weekly decline. In other words, the current move looks more like a rebound within a short-term downtrend than a confirmed reversal.
At the broader market level, Bitcoin fell 0.65% over the week, Solana 1.08%, and XRP 2.91%, while BNB had the smallest decline at 0.35%. This means Ethereum's weekly weakness is not an exception, but part of general pressure on large-cap digital assets.
The gap between the current price and the 24-hour high is about $40.78, or roughly 1.7%. The gap from the 24-hour low is about $56.33, or roughly 2.3%. These figures mean the price is currently trading in the upper part of the day's range, but has not established itself above the high.
On the weekly timeframe, the current price stands about $82.85 above the weekly low and about $81.99 below the weekly high. That is, the price is located roughly in the middle of the weekly range, an area that typically sees choppy trading and a lack of clear direction.
The distance from the all-time high remains the most prominent factor in the big picture. At $2,430.85, Ethereum is still about half below its peak. This places it in a "revaluation" position after a previous bull cycle, not in a position of exploring new highs.
Daily trading volume of $10.842 billion represents a significant proportion of the $296.83 billion market capitalization, equivalent to approximately 3.6% of market capitalization. This ratio indicates relatively good liquidity, but does not necessarily imply a clear direction.
In markets, high trading volume is often associated with high volatility. But what we see today is volatility within a range, not a breakout. This means liquidity is being used in roughly balanced buying and selling, with a slight edge for buyers on the daily timeframe.
Several factors could explain this move:
Based on the available data, some reference levels can be identified:
| Level | Price (USD) | Significance |
|---|---|---|
| 24-hour high | 2,471.63 | Short-term resistance |
| 7-day high | 2,512.84 | Weekly resistance |
| Current price | 2,430.85 | Middle of the weekly range |
| 24-hour low | 2,374.52 | Short-term support |
| 7-day low | 2,348.00 | Weekly support |
Breaking above $2,471.63 and holding above it could open the way toward $2,512.84. Conversely, breaking $2,374.52 makes $2,348.00 an important level to watch. Any break of the latter could reinforce the weekly bearish picture.
Traders often watch the daily session close relative to these levels, because a close above or below them gives a clearer signal than intraday movement.
Ethereum today is in a mixed position: a slight daily improvement, but clear weekly, monthly and yearly weakness. The price is trading in the middle of its weekly range, and trading volume is high without a decisive direction. The Fear and Greed Index at 55 leaves room for movement in either direction, and the broader market context does not support strong risk appetite.
Traders should monitor the $2,471.63 and $2,512.84 levels on the upside, and $2,374.52 and $2,348.00 on the downside. Any clear close outside this range may determine the next direction.
Disclaimer: This is an informational analysis and not investment advice. Cryptocurrency markets are highly volatile, and prices may move quickly and unexpectedly. Risk management and reviewing investment objectives are essential before any decision.
Information shown is for tracking only and is not investment advice.